by Calculated Risk on 11/28/2023 09:00:00 AM
S&P/Case-Shiller released the monthly Home Price Indices for September (“September” is a 3-month average of July, August and September closing prices).
This release includes prices for 20 individual cities, two composite indices (for 10 cities and 20 cities) and the monthly National index.
From S&P S&P CoreLogic Case-Shiller Index Continued to Trend Upward in September
The S&P CoreLogic Case-Shiller U.S. National Home Price NSA Index, covering all nine U.S. census divisions, reported a 3.9% annual change in September, up from a 2.5% change in the previous month.
The 10-City Composite showed an increase of 4.8%, up from a 3.0% increase in the previous month.
The 20-City Composite posted a year-over-year increase of 3.9%, up from a 2.1% increase in the previous month.
Detroit surpassed Chicago, reporting the highest year-over-year gain among the 20 cities with an 6.7% increase in September, followed by San Diego with a 6.5% increase. Three of the 20 cities reported lower prices in September versus a year ago.
…
Before seasonal adjustment, the U.S. National Index,10-City and 20-City Composites, all posted 0.3% month-over-month increases in September, while the 10-City and 20-City composites posted 0.3% and 0.2% increases, respectively.After seasonal adjustment, the U.S. National Index, the 10-City and 20-City Composites each posted month-over-month increases of 0.7%.
“U.S. home prices continued their rally in September 2023,” says Craig J. Lazzara, Managing Director at S&P DJI. “Our National Composite rose by 0.3% in September, marking eight consecutive monthly gains since prices bottomed in January 2023. The Composite now stands 3.9% above its year-ago level and 6.6% above its January level. Our 10- and 20-City Composites both rose in September, and likewise currently exceed their year-ago and January levels.
“We’ve commented before on the breadth of the housing market’s strength, which continued to be impressive. On a seasonally adjusted basis, all 20 cities showed price increases in September; before seasonal adjustments, 15 rose. Prices in 17 of the cities are higher than they were in September 2022. Notably, the National Composite, the 10-City Composite, and 10 individual cities (Atlanta, Boston, Charlotte, Chicago, Cleveland, Detroit, Miami, New York, Tampa, and Washington) stand at their all-time highs.”
Click on graph for larger image.
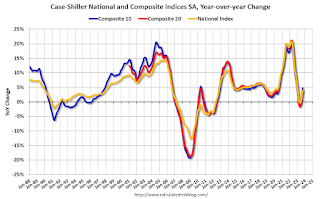
The first graph shows the nominal seasonally adjusted Composite 10, Composite 20 and National indices (the Composite 20 was started in January 2000).
The Composite 10 index is up 0.7% in September (SA) and is at a new all-time high.
The Composite 20 index is up 0.7% (SA) in September and is also at a new all-time high.
The National index is up 0.7% (SA) in September and is also at a new all-time high.

The Composite 10 SA is up 4.8% year-over-year. The Composite 20 SA is up 3.9% year-over-year.
The National index SA is up 3.9% year-over-year.
Annual price changes were close to expectations. I’ll have more later.
