
- Meta Platforms stock sells off one day after beating consensus on Q3 earnings.
- NASDAQ Composite declines more than 1% on continued equity market jitters.
- Preliminary Q3 US GDP arrives well above expectations at 4.9%.
- Meta trounced earnings consensus for the third quarter.
- The Q4 outlook appears shaky though as geopolitics intrudes on advertising sales.
Meta Platforms (META), formerly known as Facebook, has drifted 4.5% lower on Thursday in its first regular session after posting an earnings beat late Wednesday. META shares have dropped from Wednesday’s close just below $300 to $286 at the time of writing, though shares dropped mid-session to as low as $279.40.
The last 24 hours have been a tale of “fours” for Meta Platforms. Prior to earnings, the stock price dropped 4% on Wednesday, rose 4% initially afterhours on the earnings beats, then opened down over 4% on Thursday.
The NASDAQ Composite reached an official correction on Wednesday, represented by a 10% slide from its July peak. The NASDAQ has pulled back another 1.8% on Thursday, while the S&P 500 has given up 1.1%. The NASDAQ is now trading at levels not seen since late May.
Meta Platforms stock earnings: Q4 advertising uncertainty sends shares lower
Meta Platforms reported third-quarter GAAP earnings per share (EPS) of $4.39. This was an incredible 21% above consensus from Wall Street. Revenue also trounced consensus by $700 million, coming in at $34.15 billion.
The problem, if it can be called a problem, is that founder Mark Zuckerberg’s Meta Platforms is experiencing heavier volatility in advertising sales in the first few weeks of the fourth quarter. Executives zeroed in on the Israel-Palestine crisis as causing general pessimism among marketing departments as worries persist that the war could expand into a wider geopolitical crisis.
This uncertainty led executives to provide a fourth-quarter outlook on revenue of around $38.25 billion, which was $500 million below the Street’s expectation.
Facebook’s daily active users rose 5% from a year ago to 2.09 billion – about 20 million users above the forecast. Monthly active users, the more significant number, matched consensus by rising 3% YoY to 3.05 billion.
Capital expenditure dropped by more than $2 billion from a year ago, while advertising impressions from Meta’s Family of Apps segment increased by 31% YoY and the average price per ad decreased by 6% year-over-year.
Meta Platforms Net Income Chart (Source: Meta Q3 2023 earnings)
Preliminary Q3 US GDP trounces expectations
Preliminary US GDP was released before the open on Thursday. While economists already expected a decent 4.2% showing, the print came in above consensus at 4.9%. The reading is preliminary and could be revised lower in future months, but it seems to demonstrate that the US economy is coping quite well despite the high interest rate environment.
The second quarter was eventually revised down to 2.1% on an annualized basis, so Q3’s 4.9% reading may lead some to expect core inflation to remain harder for the Federal Reserve to bring down to its 2% mandate.
Still, the odds remain on the Fed keeping rates unchanged at its November 1 meeting next week, according to CME Group’s FedWatch Tool.
S&P 500 FAQs
The S&P 500 is a widely followed stock price index which measures the performance of 500 publicly owned companies, and is seen as a broad measure of the US stock market. Each company’s influence on the computation of the index is weighted based on market capitalization. This is calculated by multiplying the number of publicly traded shares of the company by the share price. The S&P 500 index has achieved impressive returns – $1.00 invested in 1970 would have yielded a return of almost $192.00 in 2022. The average annual return since its inception in 1957 has been 11.9%.
Companies are selected by committee, unlike some other indexes where they are included based on set rules. Still, they must meet certain eligibility criteria, the most important of which is market capitalization, which must be greater than or equal to $12.7 billion. Other criteria include liquidity, domicile, public float, sector, financial viability, length of time publicly traded, and representation of the industries in the economy of the United States. The nine largest companies in the index account for 27.8% of the market capitalization of the index.
There are a number of ways to trade the S&P 500. Most retail brokers and spread betting platforms allow traders to use Contracts for Difference (CFD) to place bets on the direction of the price. In addition, that can buy into Index, Mutual and Exchange Traded Funds (ETF) that track the price of the S&P 500. The most liquid of the ETFs is State Street Corporation’s SPY. The Chicago Mercantile Exchange (CME) offers futures contracts in the index and the Chicago Board of Options (CMOE) offers options as well as ETFs, inverse ETFs and leveraged ETFs.
Many different factors drive the S&P 500 but mainly it is the aggregate performance of the component companies revealed in their quarterly and annual company earnings reports. US and global macroeconomic data also contributes as it impacts on investor sentiment, which if positive drives gains. The level of interest rates, set by the Federal Reserve (Fed), also influences the S&P 500 as it affects the cost of credit, on which many corporations are heavily reliant. Therefore, inflation can be a major driver as well as other metrics which impact the Fed decisions.
Meta Platforms stock forecast
Despite its steep sell-off, Meta Platforms stock is beginning to find a supportive base on Thursday. Bulls are buying the dip, driving the price off the intraday low of $279.40 back up toward $290.
If the pullback develops further over the next few sessions, shareholders can take advantage of the August 18 and August 25 lows above $274 and $276, respectively, for buying opportunities. Below that supportive band lies the $244 level that worked all the way back in September 2020.
As the 9-day Simple Moving Average (SMA) moves below its 21-day SMA counterpart on Thursday for the first time in several weeks, traders will likely expect more downside to come until META stock retakes the $300 psychological level.
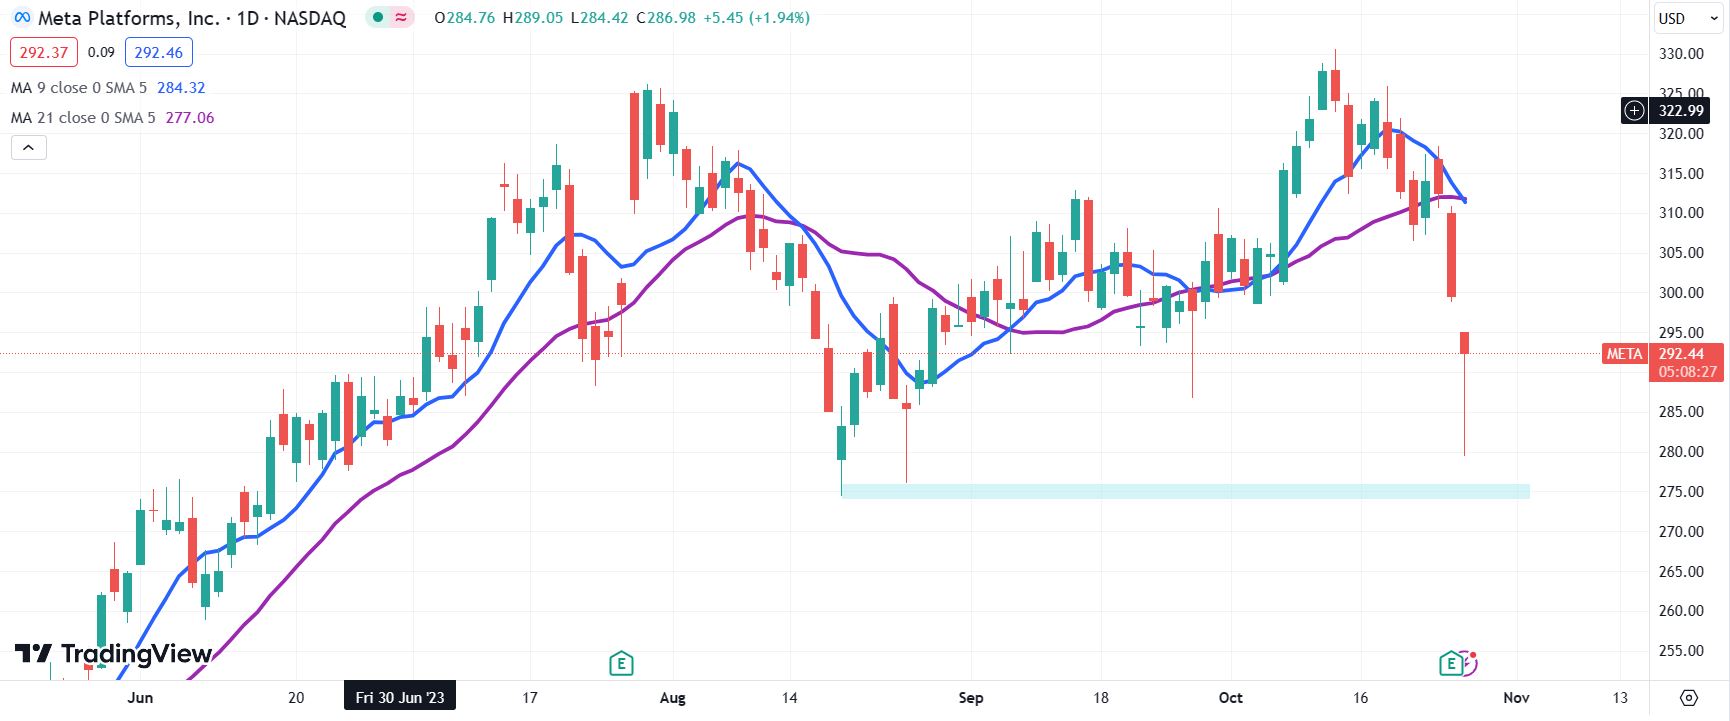
META daily chart