
EUR/USD is gradually rising from the 1.0500 level. USD/JPY is increasing and could soon try to break above the 150.00 resistance.
Important Takeaways for EUR/USD and USD/JPY Analysis Today
- The Euro has started a decent upward movement above the 1.0570 pivot level.
- On the hourly chart of EUR/USD at FXOpen, there is a significant bullish trend line with support near 1.0570.
- USD/JPY has climbed above the 149.00 and 149.45 levels.
- On the hourly chart at FXOpen, there is a connecting bullish trend line with support near 149.45.
EUR/USD Technical Analysis
On the hourly chart of EUR/USD at FXOpen, the pair has started a fresh decline from the 1.0640 zone. The Euro has dropped below the 1.0595 support zone against the US Dollar.
A low has been formed near 1.0500 and the pair is now attempting a recovery. There was a break above the 50% Fib retracement level of the downward move from the 1.0639 swing high to the 1.0495 low.
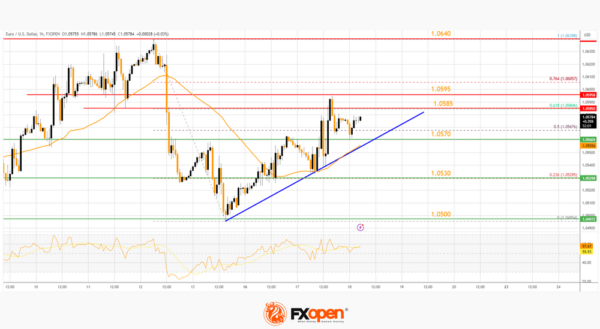
The pair has also settled above the 1.0570 zone and the 50-hour simple moving average. There is a key bullish trend line with support near 1.0570.
On the upside, the pair is now facing resistance near the 61.8% Fib retracement level of the downward move from the 1.0639 swing high to the 1.0495 low at 1.0585. The next major resistance is near 1.0595. An upside break above 1.0595 could lead to another increase. In that case, the pair might rise toward 1.0640.
If not, the pair could start a fresh decline. The first major support on the EUR/USD chart is near 1.0570. The next key support is at 1.0530. If there is a downside break below 1.0530, the pair could drop toward 1.0500. The next support is near 1.0480, and a break below it could lead to a significant decline.
USD/JPY Technical Analysis
On the hourly chart of USD/JPY at FXOpen, the pair has started a decent upward movement from the 148.15 zone. The US Dollar has gained bullish momentum above 149.00 against the Japanese Yen.
It has settled above the 50-hour simple moving average and 149.45. A high has been formed near 149.80, and the pair is now consolidating its gains. On the downside, the first major support is near the trend line at 149.45 and the 50-hour simple moving average.
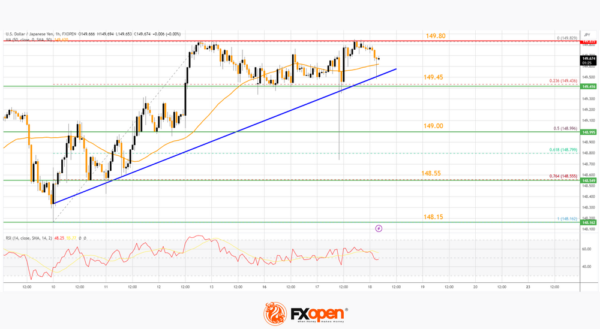
The trend line is close to the 23.6% Fib retracement level of the upward move from the 148.16 swing low to the 149.82 high. The next major support is near 149.00.
If there is a close below 149.00, the pair could decline steadily toward the 76.4% Fib retracement level of the upward move from the 148.16 swing low to the 149.82 high at 148.55. In that case, the pair might drop toward 148.15. The next major support sits at 147.50.
Immediate resistance on the USD/JPY chart is near 149.80. The first major resistance is near 150.00. If there is a close above the 150.00 level and the RSI moves above 60, the pair could rise toward 151.20. The next major resistance is near 152.00, and if it is breached, the pair could test 155.00 in the coming days.
This article represents the opinion of the Companies operating under the FXOpen brand only. It is not to be construed as an offer, solicitation, or recommendation with respect to products and services provided by the Companies operating under the FXOpen brand, nor is it to be considered financial advice.