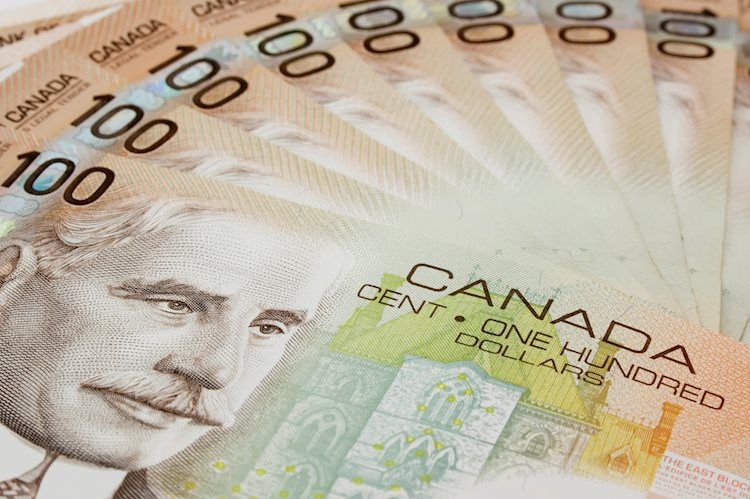
- The Canadian Dollar is falling back into familiar lows on Wednesday as investors pull up stakes.
- Canada Housing Starts came in better than expected, but risk-off flows are dominating.
- Thin calendar docket for the CAD until Friday’s Retail Sales.
The Canadian Dollar (CAD) is falling back in the American market session as risk appetite takes a turn south, sending investors back into the US Dollar (USD) and taking the USD/CAD back up the charts.
Canada Housing Starts managed to eke out a better-than-expected print, with US housing data coming in mixed, but overall market sentiment has turned risk-off mid-week, and the US Dollar is rising across the board, sending the Loonie lower in lockstep with Crude Oil prices that are declining back into the day’s opening bids.
Daily Digest Market Movers: Canadian Dollar reverses course at the midway point as risk appetite turns tail
- Canadian Housing Starts beat expectations, showing 270.5 thousand additional homes begin constructed over the year into September.
- The data easily cleared the forecast 240K, and stepped over the last reading of 250.4K (revised downwards from 253K).
- US housing data landed with mixed results, with Building Permits beating expectations but Housing Starts flubbing the forecast.
- The US issued 1.475M new building permits in September, just above the 1.45M forecast but less than August’s 1.541M (revised down from 1.543M).
- US Housing Starts disappointed markets, with 1.358M houses or apartment units beginning construction in September, less than the expected 1.38M, but still an improvement over August’s 1.269M (revised down from 1.283M).
- Thursday still sees US Initial Jobless Claims, as well as a slew of speeches from Federal Reserve (Fed) officials, including Fed Chair Jerome Powell at 16:00 GMT tomorrow.
- Crude Oil saw bidding during the early Wednesday trading session, but the American market window is seeing investors hesitate, and Oil prices are falling back to where they started.
- Global geopolitical tensions over the Israel-Hamas conflict continue to weigh on investor risk appetite.
- The US is also suffering from its own homegrown political uncertainty as the US Government struggles to replace its House Speaker who was ejected by his own party.
- US Treasury yields have hit yet another high, with the US 10-year yield at its highest yield in seventeen years near 4.92%.
Technical Analysis: Canadian Dollar falls back as traders pile back into the Greenback
USD/CAD tried to break past the 1.3700 handle on Wednesday, testing into swing high prices that have become familiar territory in recent weeks. The pair has been in a massive range for a whole year, oscillating between highs just short of 1.4000 and lows in the 1.31s. It is once again approaching the range highs.
In fact the pair is wrestling with a major trendline at around 1.3685, drawn by connecting the October 2022 and March 2023 highs, and this is likely to present tough overhead resistance. Ideally a decisive break is required to definitively put this ceiling in the rear-view mirror.
Such a break would be characterized by a longer-than-average green weekly candle breaking cleanly through the resistance line, or three successive green weekly bars.
Despite the sideways primary trend, the intermediate and short-term trends are more bullish suggesting longs have their backs to the wind. This lends a bias to more upside, and if it were not for the major resistance line there would be a green light signaling ‘go’ – as it is it could prove a spoiler.
USD/CAD Weekly Chart
Inflation FAQs
Inflation measures the rise in the price of a representative basket of goods and services. Headline inflation is usually expressed as a percentage change on a month-on-month (MoM) and year-on-year (YoY) basis. Core inflation excludes more volatile elements such as food and fuel which can fluctuate because of geopolitical and seasonal factors. Core inflation is the figure economists focus on and is the level targeted by central banks, which are mandated to keep inflation at a manageable level, usually around 2%.
The Consumer Price Index (CPI) measures the change in prices of a basket of goods and services over a period of time. It is usually expressed as a percentage change on a month-on-month (MoM) and year-on-year (YoY) basis. Core CPI is the figure targeted by central banks as it excludes volatile food and fuel inputs. When Core CPI rises above 2% it usually results in higher interest rates and vice versa when it falls below 2%. Since higher interest rates are positive for a currency, higher inflation usually results in a stronger currency. The opposite is true when inflation falls.
Although it may seem counter-intuitive, high inflation in a country pushes up the value of its currency and vice versa for lower inflation. This is because the central bank will normally raise interest rates to combat the higher inflation, which attract more global capital inflows from investors looking for a lucrative place to park their money.
Formerly, Gold was the asset investors turned to in times of high inflation because it preserved its value, and whilst investors will often still buy Gold for its safe-haven properties in times of extreme market turmoil, this is not the case most of the time. This is because when inflation is high, central banks will put up interest rates to combat it.
Higher interest rates are negative for Gold because they increase the opportunity-cost of holding Gold vis-a-vis an interest-bearing asset or placing the money in a cash deposit account. On the flipside, lower inflation tends to be positive for Gold as it brings interest rates down, making the bright metal a more viable investment alternative.
