
- The price actions of AUD/USD have started to oscillate within an impending “Descending Wedge” bullish reversal configuration.
- The emergence of the “Descending Wedge” coupled with positive reading seen in the daily RSI momentum indicator indicates its current medium-term downtrend phase from the 3 February 2023 high may be coming to its tail-end.
- In the short term, the AUD/USD is at risk of staging a potential residual push down to retest the lower boundary of the “Descending Wedge” acting as support at 0.6270/6260.
- Watch the key short-term resistance at 0.6395 on the AUD/USD.
The price actions of AUD/USD have indeed continued to churn lower towards 0.6310 support as highlighted in our last report.
It printed a recent intraday low of 0.6270 last Thursday, 26 October, and staged a bounce of +113 pips to hit a high of 0.6384 yesterday, 30 October (US session) as we await key external economic data out from China, the NBS Manufacturing and Non-Manufacturing PMI data for October that may impact the movements of the AUD/USD due to Australia’s close trading ties with China.
Consensus estimates have indicated another month of slow recovery in manufacturing and services activities in China for October, but the manufacturing PMI has slipped back to contraction mode with a reading of 49.5 from 50.2 in September while growth in the non-manufacturing PMI inched lower to 50.6, below consensus of 51.8 and September print of 51.7.
Let’s look at the AUD/USD from the lens of technical analysis.
An impending medium-term bullish reversal configuration has emerged
Fig 1: AUD/USD medium-term trend as of 31 Oct 2023 (Source: TradingView, click to enlarge chart)
Since its 5 September 2023 low of 0.6357, the AUD/USD has started to oscillate within an ongoing eight-week impending “Descending Wedge” configuration with its downside momentum abating as indicated by the bullish divergence condition being flashed out in the daily RSI momentum indicator after it hit its oversold region on 17 August 2023.
These observations (price actions pattern coupled with readings seen in momentum indicator) tend to suggest that the medium-term downtrend from the 1 February 2023 high is likely to be approaching its tail-end where a potential imminent bullish reversal may occur next.
The upper limit (resistance) of the impending “Descending Wedge” bullish reversal configuration stands at 0.6395.
Short-term momentum is still bearish
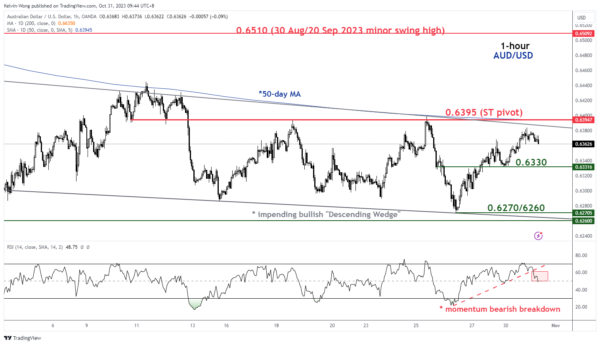
Fig 2: AUD/USD minor short-term trend as of 30 Oct 2023 (Source: TradingView, click to enlarge chart)
In the shorter-term 1-hour chart, the price actions of AUD/USD may shape a potential residual push down to retest the lower boundary of the “Descending Wedge” bullish reversal configuration as indicated by the momentum bearish breakdown condition seen in the 1-hour RSI indicator after it reached its overbought region yesterday, 30 October.
Watch the 0.6395 key short-term pivotal resistance (upper boundary of the “Descending Wedge” & 50-day moving average) for a potential slide toward the immediate supports of 0.6330 and 0.6270/6260 (lower boundary of the “Descending Wedge” & Fibonacci extension) before a potential recovery takes form.
However, a clearance above 0.6395 invalidates the bearish residual push down scenario for a bullish breakout to see the next intermediate resistance coming in at 0.6510 (30 Aug/20 September 2023 minor swing high) in the first step.