- The GBP is the second weakest currency among the major US dollar pairs in the past five days.
- A potential bearish reversal set-up has emerged for GBP/JPY while the JPY bears seem to be cautious about Japan’s MoF intervention at around the 150.30 risk level on USD/JPY.
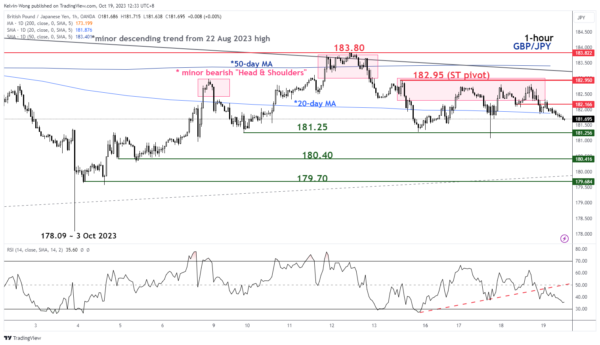
- Watch the key short-term resistance at 182.95 on the GBP/JPY.
The UK pound sterling (GBP) is the second weakest currency among the major US dollar pairs based on a five-day rolling performance calculation at this time of the writing. The USD/GBP has recorded a gain of +0.43% ex-post UK inflation data (September) that was released yesterday, 18 October.
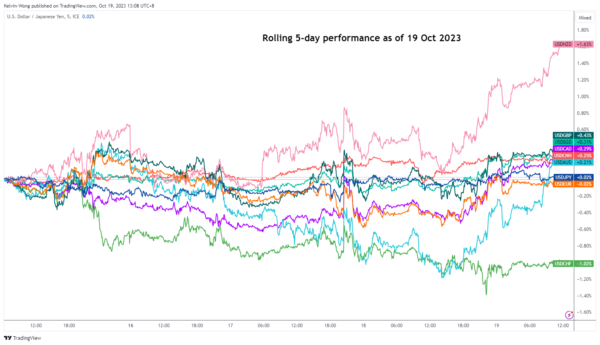
Fig 1: USD major pairs rolling 5-day performance as of 19 Oct 2023 (Source: TradingView, click to enlarge chart)
Both the headline and core inflation rates in the UK have come in slightly above expectations; (6.7% y/y vs. 6.6% y/y consensus) and (6.1% y/y vs. 6% y/y consensus) respectively.
Interestingly, the USD/JPY has continued to trade in a sideways range as the JPY bears may be getting cautious and likely on the lookout for potential intervention by Japan’s Ministry of Finance at around the 150.30 risk level on USD/JPY.
Through the lens of technical analysis, an interesting potential bearish reversal set-up has emerged for the GBP/JPY cross-pair.
Major bullish upside momentum has started to dissipate
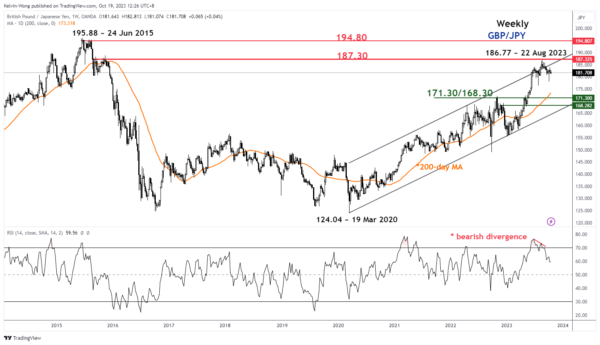
Fig 2: GBP/JPY major trend as of 19 Oct 2023 (Source: TradingView, click to enlarge chart)
In addition, the weekly RSI momentum indicator flashed a bearish divergence condition on 22 August 2023 at its overbought region which suggests that the major upside momentum has started to ease and in turn increases the odds of potential multi-week corrective decline towards the 171.30/168.30 support zone (also the 200-day moving average).
Minor bearish “Head & Shoulders” in progress
 Source Link