
- Last Monday’s Asia session (9 October) gap up in price actions seen in WTI crude oil has been filled at the US$83.20 support on Thursday, 12 October.
- A positive follow-through was seen on last Friday, 13 October where its price actions ended with a daily bullish “Marubozu” reversal candlestick pattern.
- Watch the intermediate resistance at US$88.60 which also confluences with the 20-day moving average.
A volatile week for oil prices on the backdrop of escalating geopolitical tensions in the ongoing Israel-Hamas conflict that can potentially spill over to the rest of the Middle East region.
The initial gap up in price actions of around +3% in WTI crude oil futures that ignited during the start of last Monday, 9 October Asian session managed to fill the gap on Thursday, 12 October at the US$83.20 support level before it staged a bullish reversal on Friday, 13 October.
Revival of medium-term bullish momentum
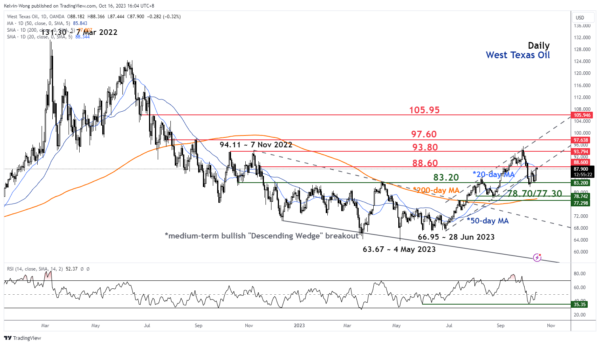
Fig 1: West Texas Oil medium-term trend as of 16 Oct 2023 (Source: TradingView, click to enlarge chart)
Throughout last Friday, 13 October session, the price actions of West Texas Oil (a proxy of WTI crude oil futures) remained on a bullish tone and ended the day with a daily bullish “Marubozu” reversal candlestick pattern.
In addition, the daily RSI momentum indicator has managed to tick higher above its 50 level which suggests a potential revival of medium-term bullish momentum.
May see a minor pull-back at this juncture before a new up move
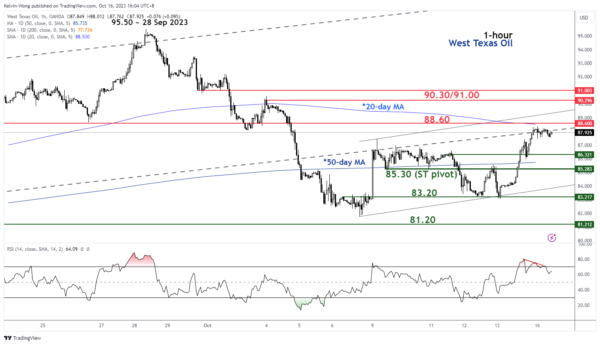
In the lens of technical analysis, price actions of highly tradable instruments do not move in a vertical fashion but rather oscillate within a trend.
Last Friday’s strong upward movement has given rise to a short-term uptrend phase for West Texas Oil in place since the 6 October 2023 low of US$81.77/barrel.
However, the minor burst up in price actions has been overstretched and the hourly RSI oscillator has flashed out a bearish divergence condition right at the overbought region which suggests that West Texas Oil may see a pull-back first to retrace a certain portion of its up move from last Thursday, 12 October low of US$83.20/barrel to Friday, 13 October high of US$88.37/barrel before a new potential up move materializes.
Watch the US$85.30 key short-term support (also the 50-day moving average & the 61.8% Fibonacci retracement of the up move from the 12 October 2023 low to the 13 October 2023 high). A clearance above US$88.60 (20-day moving average) adds impetus for a further potential upside towards the next intermediate resistance of US$90.30/US$91.00 in the first step.
On the other hand, a break below US$85.30 negates the bullish tone for a deeper slide to retest US$83.20.